When we think about road safety, most of us picture cars. After all, cars dominate U.S. traffic. But behind the scenes, motorcycles are involved in crashes and fatalities at a far higher rate, mile for mile, than passenger vehicles. Why is that? How big is the difference? And what do these statistics mean for riders, drivers, and legal professionals?
In this comprehensive article, we break down the latest U.S. accident data, compare motorcycle and car crash trends, and explain why the disparity matters for everyone on the road. All statistics are sourced from trusted national databases and safety research.
Why Compare Motorcycle and Car Accidents?
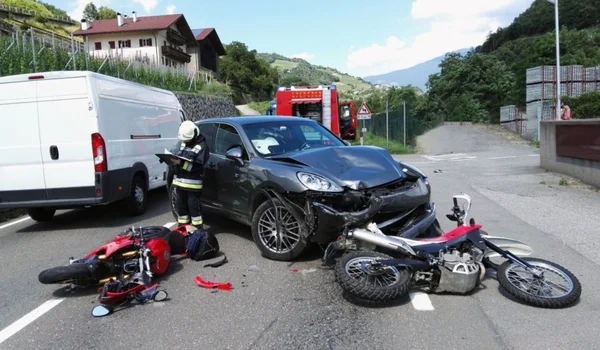
Cars and motorcycles share the same highways, yet the risk of death or serious injury is not the same for people in these vehicles. Differences in design (a motorcycle offers almost no physical protection compared to a car) and visibility (motorcycles are smaller and easier to overlook) lead to real differences in crash outcomes.
Understanding those differences matters for:
- Everyday motorists and riders, to choose safer habits
- Families making transportation decisions
- Law practices, especially those focused on personal injury and wrongful death
Let’s explore the numbers.
How Often Do Motorcycle Crashes Occur?
In 2023, 6,335 motorcyclists were killed in traffic crashes in the United States—the highest total recorded in decades. These deaths accounted for about 15 % of all traffic fatalities, despite motorcycles making up a small fraction of registered vehicles.
This imbalance highlights a key point:
Motorcyclists are far more likely to die or be seriously injured in a crash than people in cars.
In fact, the fatality rate for motorcyclists is nearly 28 times higher per vehicle mile traveled than that of passenger car occupants. This means that even if you ride a motorcycle the same number of miles as someone drives a car, your chances of being fatally injured are dramatically higher.
How Do Fatalities Compare?
Here’s a clearer picture:
- Motorcycle fatalities (2023): 6,335 riders killed.
- Motorcyclist share of total traffic deaths: ≈ 15 %.
- Motorcycles as a portion of registered vehicles: about 3 %.
So while motorcycles represent only a small percentage of vehicles on the road, they represent a much larger share of fatalities. That’s a stark contrast: a vehicle type responsible for just 3 % of the fleet accounts for roughly 15 % of deaths.
Rate of Fatality per Mile Traveled
Another useful statistic is the fatality rate per 100 million vehicle miles traveled (VMT):
- Motorcyclist fatality rate (2023): ~31.4 per 100 million VMT.
- Passenger car occupant fatality rate (2023): ~1.13 per 100 million VMT.
That means motorcycles experience nearly 28 times the fatality rate per mile when compared with cars.
For every hundred million miles traveled:
31.4 riders die on motorcycles, compared to just over 1 car occupant.
That level of risk doesn’t reflect just raw crash counts — it reflects how much more dangerous riding a motorcycle can be when corrected for exposure (distance traveled).
Injuries vs Fatalities
Motorcycle crashes also result in large numbers of non-fatal injuries:
- In 2022, there were approximately 82,687 motorcyclists injured in crashes.
The combination of injuries and deaths shows that motorcycle accidents are not only more common per mile, but also more consequential in terms of harm.
By contrast, car accident injury rates per mile traveled are much lower — and most car crashes do not result in fatalities. According to some estimates, only around 6 % of car occupants suffer severe or fatal injuries in crashes.
Why Motorcyclists Are at Higher Risk
Several factors contribute to the higher motorcycle risk:
- Lack of Physical Protection
Motorcycles do not have the structural cage, airbags, or seat belt protection that cars offer. In a collision, riders are more exposed to impact forces.
- Visibility Challenges
Smaller size and common blind spots mean motorcycles are more easily missed by other drivers, especially at intersections.
- Behavior and Riding Conditions
Factors like alcohol impairment, speeding, and road conditions also impact motorcycle safety statistics. For instance, in 2023, 41 % of riders killed in single-vehicle crashes were alcohol impaired.
- Licensing and Experience
Data suggest that a significant number of riders involved in fatal crashes are riding without a valid motorcycle license, further complicating safety outcomes.
Comparisons With Car Crash Data
Car crashes are far more common in absolute terms — simply because cars make up the vast majority of U.S. motor vehicle traffic. For example:
- Estimates suggest more than 12 million vehicle accidents occur each year in the United States.
- Millions of people are injured annually in car crashes, including over 2 million debilitating injuries.
Car accidents produce far more total crashes and injuries, but the risk of fatal crash per mile traveled is significantly lower than for motorcycles.
Demographics and Trends
Motorcycle ownership has changed over time:
- Riders today are older on average than in past decades — with around a third of fatally injured motorcyclists aged 50 or older.
- Women make up a growing share of riders, though historically they represent a smaller portion of motorcycle fatalities.
These trends matter because age and experience affect crash risk and recovery outcomes.
What This Means for Everyday Riders and Drivers
For Motorcycle Riders
Understanding these statistics can guide safer choices:
- Wear DOT-compliant helmets and protective gear.
- Avoid alcohol and limit riding at night.
- Seek rider training and proper licensing.
Safety behavior makes a practical difference — even though the inherent risk remains higher for motorcycles than cars.
For Car Drivers
Drivers should remember:
- Motorcycles can be difficult to see — stay vigilant.
- Always check mirrors and blind spots before turning or changing lanes.
- Giving motorcycles adequate space reduces crash risk.
Sharing the road responsibly helps reduce accidents for everyone.
Legal and Insurance Implications
From a law practice perspective, these statistics highlight several important points:
- Comparative Fault and Risk Assessment
In personal injury and wrongful death cases, the heightened risk for motorcyclists may influence:
- Liability arguments
- Damage valuations
- Expert testimony on expected risk behavior
- Evidence and Reconstruction
High fatality rates underscore the need for precise documentation and reconstruction in severe crash cases involving motorcycles.
- Public Policy and Client Counseling
Attorneys may use data in:
- Educating clients on risk awareness
- Supporting claims related to negligence and duty of care
Clear understanding of motorcycle vs car statistics helps lawyers frame injuries and damages in context.
Final Thoughts
The data show a stark fact:
Motorcycles are involved in far fewer total crashes than cars, but each mile ridden carries a much higher risk of fatality or serious injury than a mile driven in a car.
Numbers like 28 times the fatality rate per vehicle mile traveled may sound shocking, but they reflect the real dangers of riding without protective barriers and the importance of awareness and safety measures by all road users.
Understanding these statistics empowers everyday riders, motorists, and legal professionals alike to promote safer roads and make better decisions about transportation and legal strategy.